Sovereignty Insights
Ireland 2023: Understanding the foreign dependencies that shape its strategic position
A data driven analysis of who Ireland depends on and why it matters for European sovereignty
Ireland is one of the most globalised economies in the European Union. Its pharmaceutical hubs, its digital service platforms, its tech clusters, and its industrial assemblers make the country a central node in global value chains.
But openness comes with exposure. And exposure becomes risk when visibility is limited.
This analysis uses the FIGARO 2023 input output framework to map the foreign dependencies of companies registered in Ireland. It highlights who buys from Ireland, who supplies Ireland, and where blind spots emerge inside global supply chains.
It is the fourth chapter of our 27 country series on European strategic dependencies.
1. Ireland’s exposure to foreign demand
In 2023, companies registered in Ireland generated 526.5 billion euros in intermediate sales. A striking 67.27% of this revenue came from foreign markets. By comparison, the EU average foreign revenue dependency is 32.96%. Ireland is therefore twice as dependent on foreign demand as the typical European economy.
The internal breakdown is:
🇮🇪 Domestic market: 32.73%
🌍 Foreign markets: 67.27%
Inside the foreign share:
🇪🇺 EU markets: 28.32%
🌍 Non EU markets: 38.95%
Ireland’s economy is structurally oriented toward global markets. Foreign demand is not complementary. It is foundational.
2. Who buys from Ireland: the real top clients
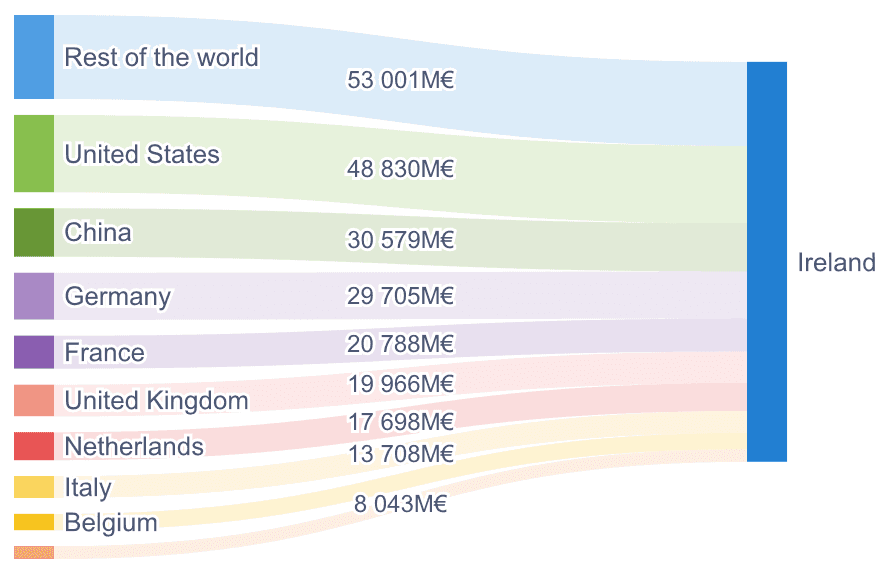
Ireland exported 354.2 billion euros of intermediate goods and services in 2023. These are the foreign buyers that shape its economic trajectory.
Top 5 foreign clients of Ireland
🏴 Rest of the World (FIGW1) – 10.07%
🇺🇸 United States – 9.27%
🇨🇳 China – 5.81%
🇩🇪 Germany – 5.64%
🇫🇷 France – 3.95%
FIGW1, Rest of the World, stands out. It is not a region or geopolitical block. It is a statistical placeholder for flows that cannot be assigned to a specific country. This means that part of Ireland’s foreign demand cannot be geographically identified. For one of the world’s most open economies, this constitutes a structural blind spot.
3. Ireland’s exposure to foreign supply
On the input side, Ireland is just as exposed. Companies purchased 507.2 billion euros of intermediate goods in 2023. A total of 66.03% of these inputs came from foreign suppliers. The EU average foreign input dependency is 35%, which means Ireland relies on foreign supply x1.89 times more than the typical EU economy.
The breakdown is:
🇪🇺 EU suppliers: 18.78%
🌍 Non EU suppliers: 47.25%
Foreign inputs dominate Ireland’s production system. The country depends structurally on international supply chains to operate its domestic industries.
4. Who supplies Ireland: the top foreign providers
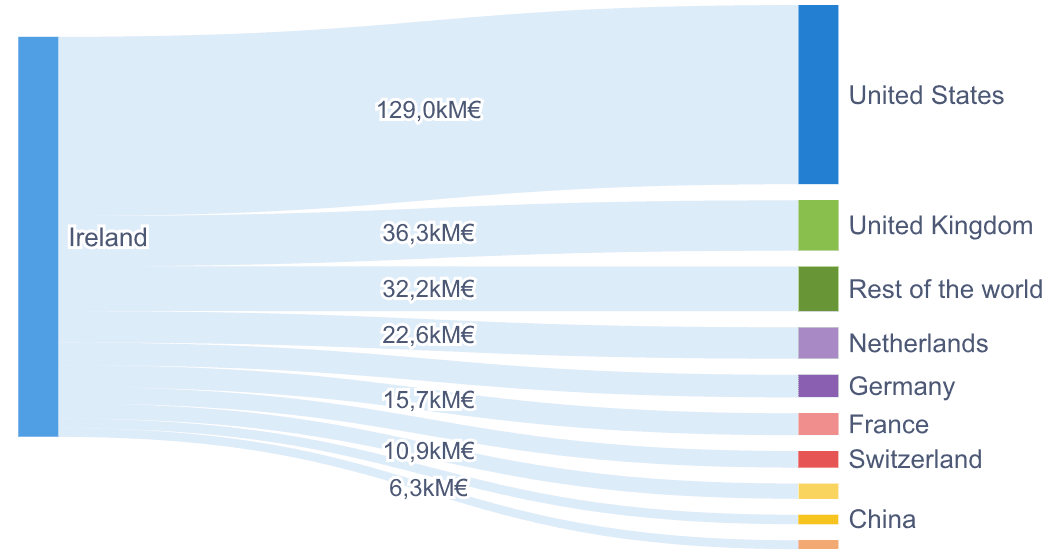
These are the foreign partners that matter the most for Ireland’s industrial continuity.
Top 5 foreign suppliers of Ireland
🇺🇸 United States – 25.43%
🇬🇧 United Kingdom – 7.15%
🏴 Rest of the World (FIGW1) – 6.35%
🇳🇱 Netherlands – 4.45%
🇩🇪 Germany – 3.2%
This structure displays three layers:
Strategic bilateral dependencies (United States, United Kingdom)
European supply chain integration (Netherlands, Germany, Belgium)
Opaque segments of the supply chain (FIGW1)
Once again, Rest of the World appears near the top, confirming a recurring structural pattern.
5. Comparing Ireland to the EU: a structural outlier
Ireland is not simply above the European average. It is an outlier.
Foreign revenue dependency :
🇮🇪 Ireland: 67.27%
🇪🇺EU average: 32.96%
x2.04 times the EU average
Foreign input dependency :
🇮🇪 Ireland: 66.03 percent
🇪🇺 EU average: 35 percent
x1.89 times the EU average
When it comes to external exposure, Ireland is not in the middle of the European distribution. It is at the extreme end.
6. The FIGW1 problem: structural opacity
FIGW1 appears prominently in both the revenue and input structure. This is not a statistical detail. It is evidence of a blind spot embedded directly inside Ireland’s supply chains.
FIGW1 (Rest of The World) hides:
multi tier suppliers
offshore intermediaries
contract manufacturers
low transparency jurisdictions
logistical nodes that do not appear in public data
These are the points of failure that become visible only during crises.
7. Why these dependencies matter
Ireland is not vulnerable because it is open. It becomes vulnerable when its openness is opaque. A dependency you can see is a dependency you can manage. A dependency you cannot see is a risk you do not control. Ireland depends on foreign markets for two thirds of its revenue and on foreign suppliers for two thirds of its industrial inputs.
Some of these dependencies are mapped. Others remain invisible. The invisible part is the one that shapes systemic risk.
8. What Sentinel enables
Sentinel is designed to reveal what FIGW1 hides. It provides leaders with:
a clear map of foreign dependencies
multi tier supply chain reconstruction
identification of critical nodes
quantification of exposure across countries and sectors
visibility into blind spots that conventional datasets cannot resolve
Strategic sovereignty is not about self sufficiency. It is about visibility.
9. Conclusion and next country
Ireland displays a distinctive pattern:
exceptionally high dependency on foreign demand
exceptionally high dependency on foreign supply
deep bilateral reliance on the United States and United Kingdom
structural opacity inside FIGW1
a level of external exposure unmatched by most EU economies
This is analysis 4 of 27.
The next country will be Denmark 🇩🇰
Understanding dependencies is the first step to managing them. The next chapters will continue to map Europe’s strategic exposure.
Ireland is one of the most globalised economies in the European Union. Its pharmaceutical hubs, its digital service platforms, its tech clusters, and its industrial assemblers make the country a central node in global value chains.
But openness comes with exposure. And exposure becomes risk when visibility is limited.
This analysis uses the FIGARO 2023 input output framework to map the foreign dependencies of companies registered in Ireland. It highlights who buys from Ireland, who supplies Ireland, and where blind spots emerge inside global supply chains.
It is the fourth chapter of our 27 country series on European strategic dependencies.
1. Ireland’s exposure to foreign demand
In 2023, companies registered in Ireland generated 526.5 billion euros in intermediate sales. A striking 67.27% of this revenue came from foreign markets. By comparison, the EU average foreign revenue dependency is 32.96%. Ireland is therefore twice as dependent on foreign demand as the typical European economy.
The internal breakdown is:
🇮🇪 Domestic market: 32.73%
🌍 Foreign markets: 67.27%
Inside the foreign share:
🇪🇺 EU markets: 28.32%
🌍 Non EU markets: 38.95%
Ireland’s economy is structurally oriented toward global markets. Foreign demand is not complementary. It is foundational.
2. Who buys from Ireland: the real top clients
Ireland exported 354.2 billion euros of intermediate goods and services in 2023. These are the foreign buyers that shape its economic trajectory.
Top 5 foreign clients of Ireland
🏴 Rest of the World (FIGW1) – 10.07%
🇺🇸 United States – 9.27%
🇨🇳 China – 5.81%
🇩🇪 Germany – 5.64%
🇫🇷 France – 3.95%
FIGW1, Rest of the World, stands out. It is not a region or geopolitical block. It is a statistical placeholder for flows that cannot be assigned to a specific country. This means that part of Ireland’s foreign demand cannot be geographically identified. For one of the world’s most open economies, this constitutes a structural blind spot.
3. Ireland’s exposure to foreign supply
On the input side, Ireland is just as exposed. Companies purchased 507.2 billion euros of intermediate goods in 2023. A total of 66.03% of these inputs came from foreign suppliers. The EU average foreign input dependency is 35%, which means Ireland relies on foreign supply x1.89 times more than the typical EU economy.
The breakdown is:
🇪🇺 EU suppliers: 18.78%
🌍 Non EU suppliers: 47.25%
Foreign inputs dominate Ireland’s production system. The country depends structurally on international supply chains to operate its domestic industries.
4. Who supplies Ireland: the top foreign providers
These are the foreign partners that matter the most for Ireland’s industrial continuity.
Top 5 foreign suppliers of Ireland
🇺🇸 United States – 25.43%
🇬🇧 United Kingdom – 7.15%
🏴 Rest of the World (FIGW1) – 6.35%
🇳🇱 Netherlands – 4.45%
🇩🇪 Germany – 3.2%
This structure displays three layers:
Strategic bilateral dependencies (United States, United Kingdom)
European supply chain integration (Netherlands, Germany, Belgium)
Opaque segments of the supply chain (FIGW1)
Once again, Rest of the World appears near the top, confirming a recurring structural pattern.
5. Comparing Ireland to the EU: a structural outlier
Ireland is not simply above the European average. It is an outlier.
Foreign revenue dependency :
🇮🇪 Ireland: 67.27%
🇪🇺EU average: 32.96%
x2.04 times the EU average
Foreign input dependency :
🇮🇪 Ireland: 66.03 percent
🇪🇺 EU average: 35 percent
x1.89 times the EU average
When it comes to external exposure, Ireland is not in the middle of the European distribution. It is at the extreme end.
6. The FIGW1 problem: structural opacity
FIGW1 appears prominently in both the revenue and input structure. This is not a statistical detail. It is evidence of a blind spot embedded directly inside Ireland’s supply chains.
FIGW1 (Rest of The World) hides:
multi tier suppliers
offshore intermediaries
contract manufacturers
low transparency jurisdictions
logistical nodes that do not appear in public data
These are the points of failure that become visible only during crises.
7. Why these dependencies matter
Ireland is not vulnerable because it is open. It becomes vulnerable when its openness is opaque. A dependency you can see is a dependency you can manage. A dependency you cannot see is a risk you do not control. Ireland depends on foreign markets for two thirds of its revenue and on foreign suppliers for two thirds of its industrial inputs.
Some of these dependencies are mapped. Others remain invisible. The invisible part is the one that shapes systemic risk.
8. What Sentinel enables
Sentinel is designed to reveal what FIGW1 hides. It provides leaders with:
a clear map of foreign dependencies
multi tier supply chain reconstruction
identification of critical nodes
quantification of exposure across countries and sectors
visibility into blind spots that conventional datasets cannot resolve
Strategic sovereignty is not about self sufficiency. It is about visibility.
9. Conclusion and next country
Ireland displays a distinctive pattern:
exceptionally high dependency on foreign demand
exceptionally high dependency on foreign supply
deep bilateral reliance on the United States and United Kingdom
structural opacity inside FIGW1
a level of external exposure unmatched by most EU economies
This is analysis 4 of 27.
The next country will be Denmark 🇩🇰
Understanding dependencies is the first step to managing them. The next chapters will continue to map Europe’s strategic exposure.