
Sovereignty Insights
Austria 2023: Understanding the foreign dependencies shaping its strategic position
A data driven analysis of who Austria depends on and why it matters for European sovereignty
Austria is often perceived as a stable and well integrated European economy. Its central geographic position, strong industrial base, and deep ties to neighboring EU countries have long supported the idea of a resilient and balanced economic model.
But stability does not mean autonomy. And integration does not eliminate dependency.
Like all modern economies, Austria is defined not only by what it produces, but by who it depends on to sell, to source, and to operate.
This analysis uses the FIGARO 2023 input output framework to map the foreign dependencies of companies registered in Austria. It identifies who buys from Austria, who supplies Austria, and where blind spots remain inside global value chains.
This is Issue 7 of 27 in our European Strategic Dependency series.
1. Austria’s exposure to foreign demand
In 2023, companies registered in Austria generated 491.9 billion euros in intermediate sales. Of this total, 29.8 % came from foreign markets.
At EU level, the average foreign revenue dependency is 32.96 %. Austria therefore ranks 16th out of 27 EU member states, slightly below the European average.
The internal breakdown is the following:
🇦🇹 Domestic market: 70.2 %
🌍 Foreign markets: 29.8 %
Inside the foreign share:
🇪🇺 EU markets: 18.96 %
🌍 Non EU markets: 10.84 %
Foreign demand is not marginal for Austria. It is a structural component of its economic activity, even if it remains less dominant than in highly export driven economies.
2. Who buys from Austria: the real top clients
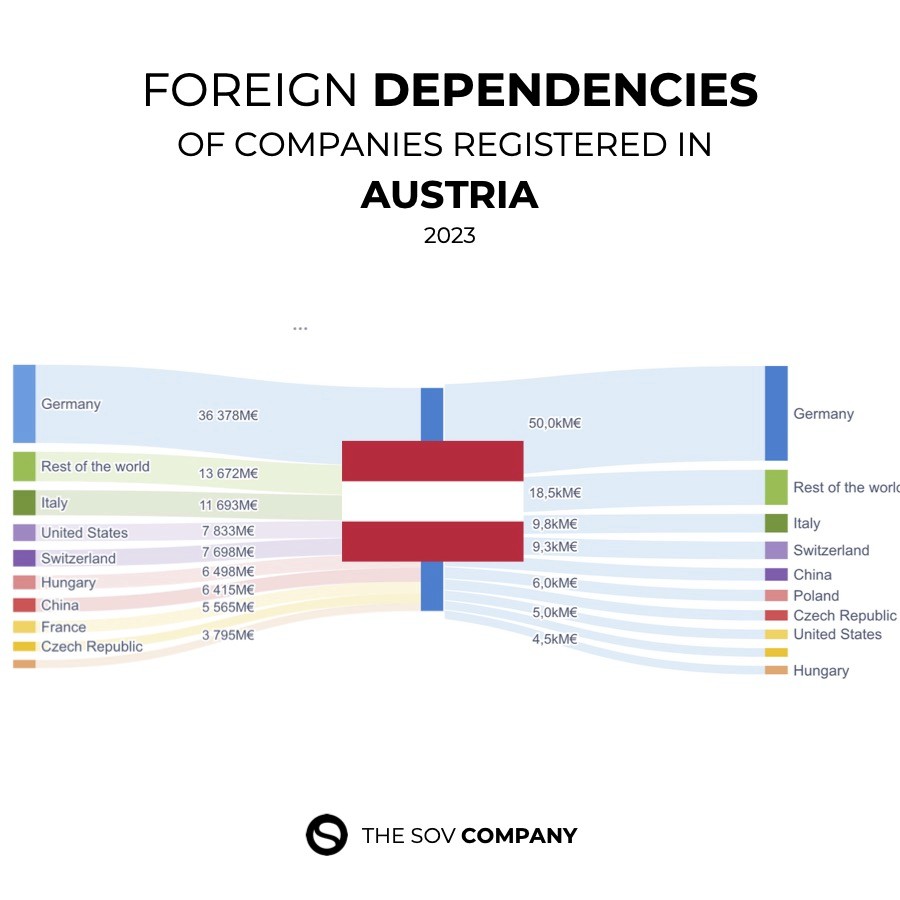
Austria exported 146.5 billion euros of intermediate goods and services in 2023. These are the foreign buyers that matter the most.
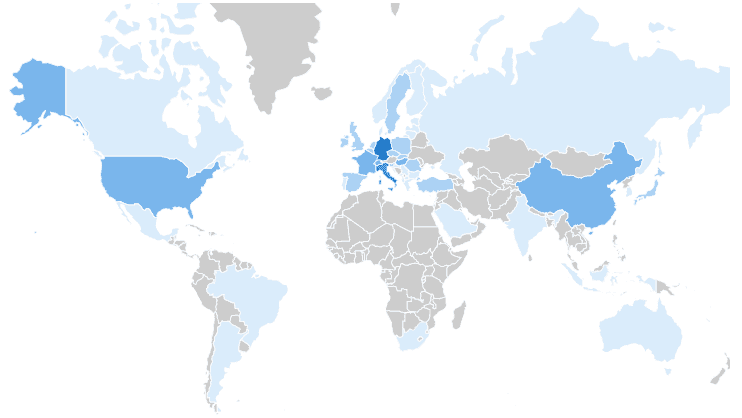
Top 5 foreign clients of Austria 🇦🇹 :
🇩🇪 Germany 7.4 %
🏴 Rest of the World (FIGW1) 2.78 %
🇮🇹 Italy 2.38 %
🇺🇸 United States 1.59 %
🇨🇭 Switzerland 1.57 %
Germany stands out clearly as Austria’s primary external market, reflecting deep industrial and commercial integration between the two economies.
More striking is the position of FIGW1, Rest of the World. It represents foreign demand that cannot be attributed to identifiable countries.
This means that a meaningful share of Austria’s exports flows toward partners that remain statistically undefined.
3. Austria’s exposure to foreign supply
On the input side, Austria displays a similar structure. In 2023, companies registered in Austria purchased 508.3 billion euros of intermediate goods and services. 32.06 % of these inputs came from foreign suppliers.
The EU average foreign input dependency is 35 %. Austria ranks 15th out of 27, again slightly below the European mean.
The structure is the following:
🇪🇺 EU suppliers: 21.46 %
🌍 Non EU suppliers: 10.6 %
Austria’s production system relies strongly on European supply chains, while still maintaining exposure to global inputs.
4. Who supplies Austria: the top foreign providers
These are the foreign suppliers with the greatest weight in Austria’s input structure.
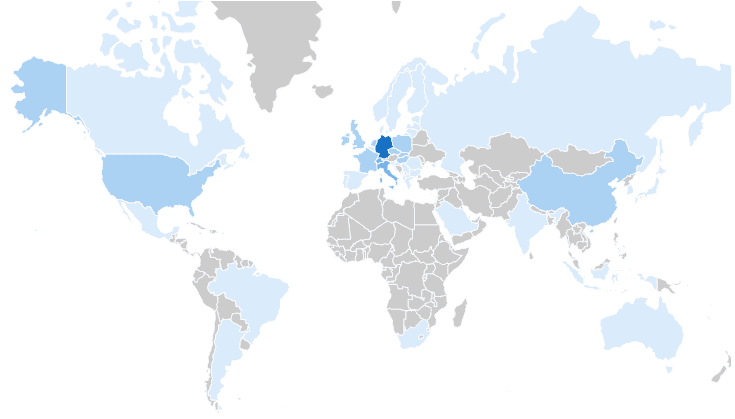
Top 5 foreign suppliers of Austria 🇦🇹
🇩🇪 Germany 9.84 %
🏴 Rest of the World (FIGW1) 3.64 %
🇮🇹 Italy 1.92 %
🇨🇭 Switzerland 1.82 %
🇨🇳 China 1.30 %
Germany dominates Austria’s supply chain landscape, reinforcing the country’s reliance on its largest neighbor.
Once again, FIGW1 appears among the top foreign partners, confirming that part of Austria’s supply chain remains opaque at country level.
5. Austria compared to the EU: moderate exposure, persistent blind spots
Austria sits close to the European average on both demand and supply exposure.
Foreign revenue dependency:
🇦🇹 Austria 29.8 %
🇪🇺 EU average 32.96 %
Foreign input dependency:
🇦🇹 Austria 32.06 %
🇪🇺 EU average 35 %
This profile reflects a balanced and integrated economy. But balance does not eliminate risk.
6. The FIGW1 problem: structural opacity
FIGW1 (Rest of the World) appears on both sides of Austria’s value chains.
Rest of the World hides:
multi tier suppliers
offshore intermediaries
logistics hubs
manufacturing subcontractors
jurisdictions with limited transparency
These actors do not appear in country level statistics, yet they play a real role in Austria’s economic functioning. Even economies with moderate exposure carry invisible dependencies.
7. Why these dependencies matter
Austria is not vulnerable because it is integrated. It becomes vulnerable when integration is opaque.
A dependency that can be seen can be managed.
A dependency that cannot be seen remains a latent risk.
Nearly one third of Austria’s economic flows depend on foreign actors.
Part of this exposure is mapped.
Part of it remains invisible.
8. What Sentinel enables
Sentinel is designed to reveal what aggregated datasets conceal.
It allows decision makers to:
map real foreign dependencies
reconstruct multi tier value chains
identify critical nodes
measure exposure by country and sector
detect blind spots before they become failures
Strategic sovereignty is not about isolation. It is about visibility.
9. Conclusion and next country
Austria displays a clear and recurring European pattern:
moderate but structural foreign dependency
strong reliance on Germany
deep EU integration
persistent exposure to unidentifiable partners
and blind spots embedded in FIGW1
This is Issue 7 of 27. Next country: Belgium 🇧🇪
Understanding dependencies is the first step to managing them.
The next analyses will continue to map Europe’s strategic exposure.
Austria is often perceived as a stable and well integrated European economy. Its central geographic position, strong industrial base, and deep ties to neighboring EU countries have long supported the idea of a resilient and balanced economic model.
But stability does not mean autonomy. And integration does not eliminate dependency.
Like all modern economies, Austria is defined not only by what it produces, but by who it depends on to sell, to source, and to operate.
This analysis uses the FIGARO 2023 input output framework to map the foreign dependencies of companies registered in Austria. It identifies who buys from Austria, who supplies Austria, and where blind spots remain inside global value chains.
This is Issue 7 of 27 in our European Strategic Dependency series.
1. Austria’s exposure to foreign demand
In 2023, companies registered in Austria generated 491.9 billion euros in intermediate sales. Of this total, 29.8 % came from foreign markets.
At EU level, the average foreign revenue dependency is 32.96 %. Austria therefore ranks 16th out of 27 EU member states, slightly below the European average.
The internal breakdown is the following:
🇦🇹 Domestic market: 70.2 %
🌍 Foreign markets: 29.8 %
Inside the foreign share:
🇪🇺 EU markets: 18.96 %
🌍 Non EU markets: 10.84 %
Foreign demand is not marginal for Austria. It is a structural component of its economic activity, even if it remains less dominant than in highly export driven economies.
2. Who buys from Austria: the real top clients
Austria exported 146.5 billion euros of intermediate goods and services in 2023. These are the foreign buyers that matter the most.
Top 5 foreign clients of Austria 🇦🇹 :
🇩🇪 Germany 7.4 %
🏴 Rest of the World (FIGW1) 2.78 %
🇮🇹 Italy 2.38 %
🇺🇸 United States 1.59 %
🇨🇭 Switzerland 1.57 %
Germany stands out clearly as Austria’s primary external market, reflecting deep industrial and commercial integration between the two economies.
More striking is the position of FIGW1, Rest of the World. It represents foreign demand that cannot be attributed to identifiable countries.
This means that a meaningful share of Austria’s exports flows toward partners that remain statistically undefined.
3. Austria’s exposure to foreign supply
On the input side, Austria displays a similar structure. In 2023, companies registered in Austria purchased 508.3 billion euros of intermediate goods and services. 32.06 % of these inputs came from foreign suppliers.
The EU average foreign input dependency is 35 %. Austria ranks 15th out of 27, again slightly below the European mean.
The structure is the following:
🇪🇺 EU suppliers: 21.46 %
🌍 Non EU suppliers: 10.6 %
Austria’s production system relies strongly on European supply chains, while still maintaining exposure to global inputs.
4. Who supplies Austria: the top foreign providers
These are the foreign suppliers with the greatest weight in Austria’s input structure.
Top 5 foreign suppliers of Austria 🇦🇹
🇩🇪 Germany 9.84 %
🏴 Rest of the World (FIGW1) 3.64 %
🇮🇹 Italy 1.92 %
🇨🇭 Switzerland 1.82 %
🇨🇳 China 1.30 %
Germany dominates Austria’s supply chain landscape, reinforcing the country’s reliance on its largest neighbor.
Once again, FIGW1 appears among the top foreign partners, confirming that part of Austria’s supply chain remains opaque at country level.
5. Austria compared to the EU: moderate exposure, persistent blind spots
Austria sits close to the European average on both demand and supply exposure.
Foreign revenue dependency:
🇦🇹 Austria 29.8 %
🇪🇺 EU average 32.96 %
Foreign input dependency:
🇦🇹 Austria 32.06 %
🇪🇺 EU average 35 %
This profile reflects a balanced and integrated economy. But balance does not eliminate risk.
6. The FIGW1 problem: structural opacity
FIGW1 (Rest of the World) appears on both sides of Austria’s value chains.
Rest of the World hides:
multi tier suppliers
offshore intermediaries
logistics hubs
manufacturing subcontractors
jurisdictions with limited transparency
These actors do not appear in country level statistics, yet they play a real role in Austria’s economic functioning. Even economies with moderate exposure carry invisible dependencies.
7. Why these dependencies matter
Austria is not vulnerable because it is integrated. It becomes vulnerable when integration is opaque.
A dependency that can be seen can be managed.
A dependency that cannot be seen remains a latent risk.
Nearly one third of Austria’s economic flows depend on foreign actors.
Part of this exposure is mapped.
Part of it remains invisible.
8. What Sentinel enables
Sentinel is designed to reveal what aggregated datasets conceal.
It allows decision makers to:
map real foreign dependencies
reconstruct multi tier value chains
identify critical nodes
measure exposure by country and sector
detect blind spots before they become failures
Strategic sovereignty is not about isolation. It is about visibility.
9. Conclusion and next country
Austria displays a clear and recurring European pattern:
moderate but structural foreign dependency
strong reliance on Germany
deep EU integration
persistent exposure to unidentifiable partners
and blind spots embedded in FIGW1
This is Issue 7 of 27. Next country: Belgium 🇧🇪
Understanding dependencies is the first step to managing them.
The next analyses will continue to map Europe’s strategic exposure.
