
Sovereignty Insights
Finland 2023: Understanding the foreign dependencies that shape its strategic position
A data driven analysis of who Finland depends on and why it matters for European sovereignty
Finland is often described as one of Europe’s most resilient economies. A strong industrial base, high institutional trust, and deep regional integration have long supported this perception.
But resilience is not only about stability. It is about understanding where dependencies lie, and whether they are fully visible.
This analysis uses the FIGARO 2023 input output framework to map the foreign dependencies of companies registered in Finland. It highlights who buys from Finland, who supplies Finland, and where blind spots emerge inside global value chains.
It is the sixth chapter of our 27 country series on European strategic dependencies.
1. Finland’s exposure to foreign demand
In 2023, companies registered in Finland generated 270.0 billion euros in intermediate sales. 28.18% of this revenue came from foreign markets.
By comparison, the EU average foreign revenue dependency is 32.96%. Finland therefore ranks 18th out of 27 EU member states.
The internal breakdown is:
🇫🇮 Domestic market: 71.82%
🌍 Foreign markets: 28.18%
Inside the foreign share:
🇪🇺 EU markets: 14.15 %
🌍 Non EU markets: 14.03 %
Foreign demand plays a meaningful role in Finland’s economy, but it is clearly less dominant than in most EU member states.
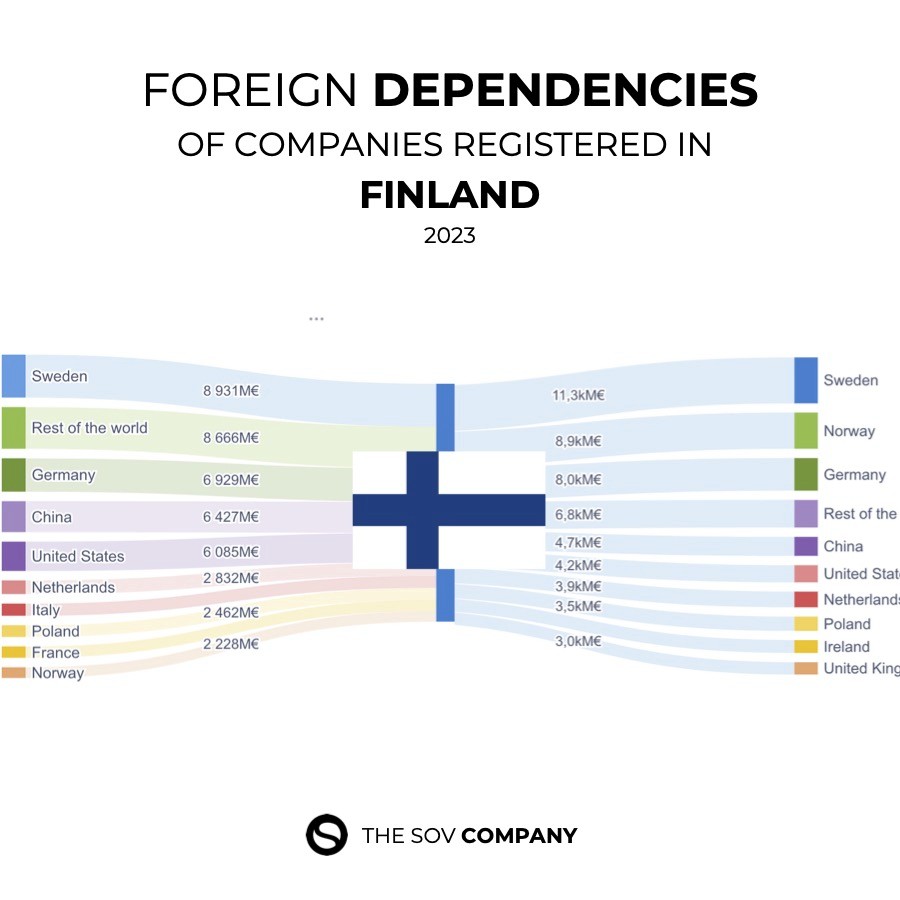
2. Who buys from Finland: the real top clients
Finland exported 76.1 billion euros of intermediate goods and services in 2023. These are the foreign buyers that shape its external exposure.
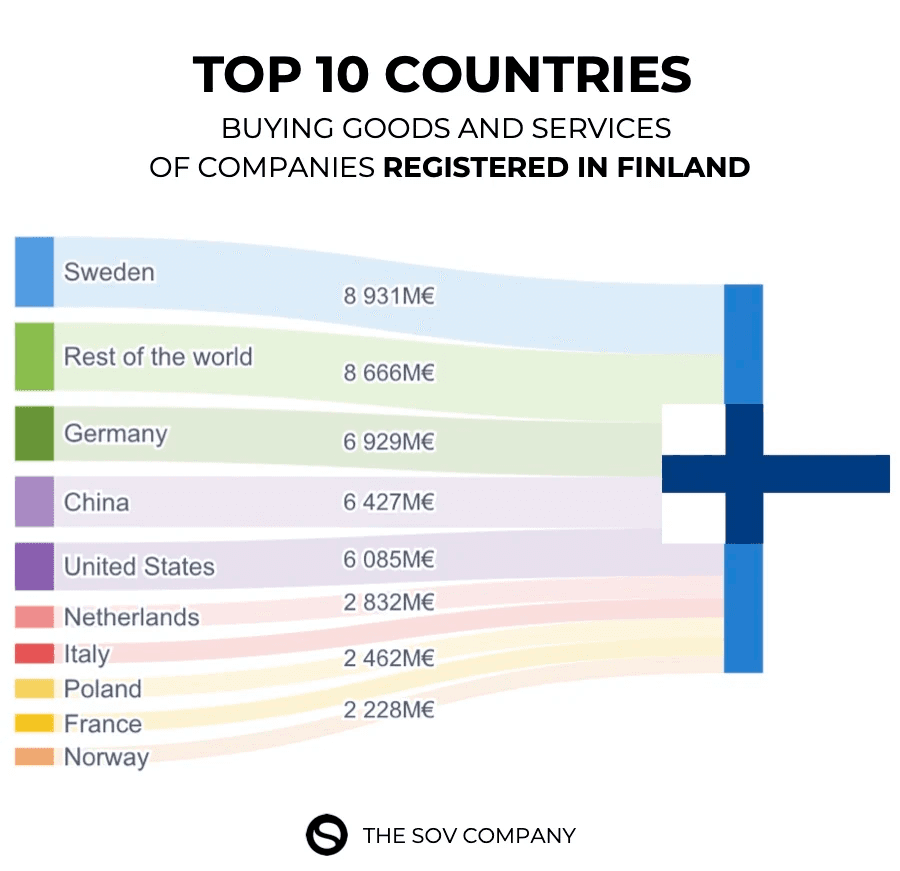
Top 5 foreign clients of Finland
🇸🇪 Sweden 3.31 %
🏴 Rest of the World (FIGW1) 3.21 %
🇩🇪 Germany 2.57 %
🇨🇳 China 2.38 %
🇺🇸 United States 2.25 %
Finland’s export structure reflects strong regional integration, particularly with Sweden and Germany.
At the same time, the presence of FIGW1 near the top signals a familiar issue. Rest of the World is not a country or a geopolitical bloc. It is a statistical category used when trade flows cannot be assigned to specific partner countries.
This means that a portion of Finland’s foreign demand cannot be clearly identified at country level. Even for a relatively low exposure economy, this represents a structural blind spot.
3. Finland’s exposure to foreign supply
On the input side, Finland displays a comparable profile. In 2023, companies registered in Finland purchased 277.3 billion euros of intermediate goods and services. 30.06% of these inputs came from foreign suppliers.
The EU average foreign input dependency is 35 %. Finland again ranks 18th out of 27 EU member states.
The breakdown is:
🇪🇺 EU suppliers: 17.01 %
🌍 Non EU suppliers: 13.05 %
Foreign supply is important, but Finland relies more heavily on domestic production and regional sourcing than most European economies.
4. Who supplies Finland: the top foreign providers
These are the foreign partners that matter most for Finland’s industrial continuity.
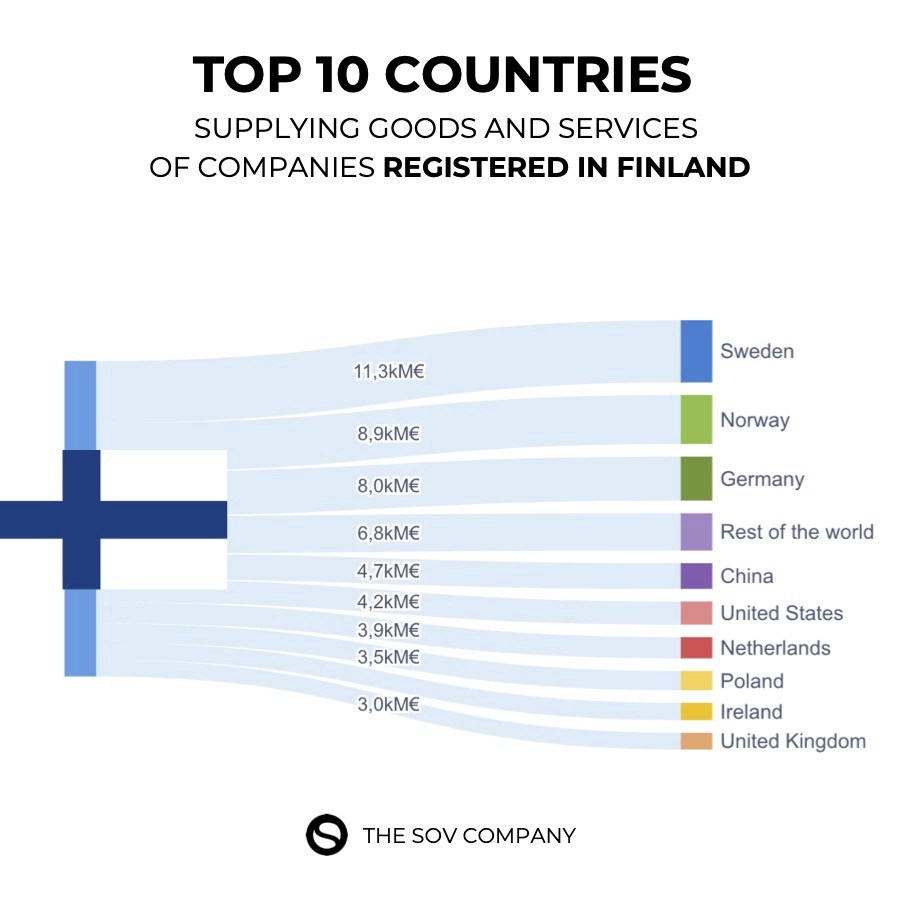
Top 5 foreign suppliers of Finland
🇸🇪 Sweden 4.09 %
🇳🇴 Norway 3.22 %
🇩🇪 Germany 2.89 %
🏴 Rest of the World (FIGW1) 2.46 %
🇨🇳 China 1.69 %
Finland’s supply chain structure highlights:
strong Nordic integration
close ties with core European industrial partners
limited but non negligible exposure to global manufacturing hubs
persistent opacity through FIGW1
5. Comparing Finland to the EU: below average exposure
Finland is clearly positioned below the European average on both sides of its value chains.
Foreign revenue dependency:
🇫🇮 Finland: 28.18 %
🇪🇺 EU average: 32.96 %
Rank: 18 / 27
Foreign input dependency:
🇫🇮 Finland: 30.06 %
🇪🇺 EU average: 35 %
Rank: 18 / 27
Finland sits in the lower half of the EU distribution. Its economic model relies less on foreign demand and foreign supply than most member states.
6. The FIGW1 problem: limited exposure, persistent opacity
Even in a relatively low exposure economy, FIGW1 appears on both sides of Finland’s trade structure.
FIGW1 hides:
multi tier suppliers
offshore intermediaries
logistics nodes outside standard reporting frameworks
actors operating below statistical visibility
The scale is smaller than in highly globalised economies, but the nature of the risk is the same. Opacity does not disappear when exposure decreases.
7. Why these dependencies matter
Finland is not vulnerable because it is open. It becomes vulnerable when parts of this openness are opaque.
A dependency you can see is a dependency you can manage.
A dependency you cannot see is a risk you do not control.
Finland depends on foreign markets for less than one third of its revenue and on foreign suppliers for less than one third of its industrial inputs. Some of these dependencies are mapped. Others are not.
The invisible part is where systemic risk accumulates.
8. What Sentinel enables
Sentinel is designed to reveal what FIGW1 hides. It provides decision makers with:
a clear map of foreign dependencies
multi tier supply chain reconstruction
identification of critical nodes
quantification of exposure across countries and sectors
visibility into blind spots that conventional datasets cannot resolve
Strategic sovereignty is not about self sufficiency. It is about visibility.
9. Conclusion and next country
Finland displays a distinct pattern:
below average dependency on foreign demand
below average dependency on foreign supply
strong Nordic and European integration
limited but persistent exposure to unidentifiable partners
a relatively resilient structure with remaining blind spots
This is analysis 6 of 27. The next country will be Austria 🇦🇹.
Understanding dependencies is the first step to managing them. The next chapters will continue to map Europe’s strategic exposure.
Finland is often described as one of Europe’s most resilient economies. A strong industrial base, high institutional trust, and deep regional integration have long supported this perception.
But resilience is not only about stability. It is about understanding where dependencies lie, and whether they are fully visible.
This analysis uses the FIGARO 2023 input output framework to map the foreign dependencies of companies registered in Finland. It highlights who buys from Finland, who supplies Finland, and where blind spots emerge inside global value chains.
It is the sixth chapter of our 27 country series on European strategic dependencies.
1. Finland’s exposure to foreign demand
In 2023, companies registered in Finland generated 270.0 billion euros in intermediate sales. 28.18% of this revenue came from foreign markets.
By comparison, the EU average foreign revenue dependency is 32.96%. Finland therefore ranks 18th out of 27 EU member states.
The internal breakdown is:
🇫🇮 Domestic market: 71.82%
🌍 Foreign markets: 28.18%
Inside the foreign share:
🇪🇺 EU markets: 14.15 %
🌍 Non EU markets: 14.03 %
Foreign demand plays a meaningful role in Finland’s economy, but it is clearly less dominant than in most EU member states.
2. Who buys from Finland: the real top clients
Finland exported 76.1 billion euros of intermediate goods and services in 2023. These are the foreign buyers that shape its external exposure.
Top 5 foreign clients of Finland
🇸🇪 Sweden 3.31 %
🏴 Rest of the World (FIGW1) 3.21 %
🇩🇪 Germany 2.57 %
🇨🇳 China 2.38 %
🇺🇸 United States 2.25 %
Finland’s export structure reflects strong regional integration, particularly with Sweden and Germany.
At the same time, the presence of FIGW1 near the top signals a familiar issue. Rest of the World is not a country or a geopolitical bloc. It is a statistical category used when trade flows cannot be assigned to specific partner countries.
This means that a portion of Finland’s foreign demand cannot be clearly identified at country level. Even for a relatively low exposure economy, this represents a structural blind spot.
3. Finland’s exposure to foreign supply
On the input side, Finland displays a comparable profile. In 2023, companies registered in Finland purchased 277.3 billion euros of intermediate goods and services. 30.06% of these inputs came from foreign suppliers.
The EU average foreign input dependency is 35 %. Finland again ranks 18th out of 27 EU member states.
The breakdown is:
🇪🇺 EU suppliers: 17.01 %
🌍 Non EU suppliers: 13.05 %
Foreign supply is important, but Finland relies more heavily on domestic production and regional sourcing than most European economies.
4. Who supplies Finland: the top foreign providers
These are the foreign partners that matter most for Finland’s industrial continuity.
Top 5 foreign suppliers of Finland
🇸🇪 Sweden 4.09 %
🇳🇴 Norway 3.22 %
🇩🇪 Germany 2.89 %
🏴 Rest of the World (FIGW1) 2.46 %
🇨🇳 China 1.69 %
Finland’s supply chain structure highlights:
strong Nordic integration
close ties with core European industrial partners
limited but non negligible exposure to global manufacturing hubs
persistent opacity through FIGW1
5. Comparing Finland to the EU: below average exposure
Finland is clearly positioned below the European average on both sides of its value chains.
Foreign revenue dependency:
🇫🇮 Finland: 28.18 %
🇪🇺 EU average: 32.96 %
Rank: 18 / 27
Foreign input dependency:
🇫🇮 Finland: 30.06 %
🇪🇺 EU average: 35 %
Rank: 18 / 27
Finland sits in the lower half of the EU distribution. Its economic model relies less on foreign demand and foreign supply than most member states.
6. The FIGW1 problem: limited exposure, persistent opacity
Even in a relatively low exposure economy, FIGW1 appears on both sides of Finland’s trade structure.
FIGW1 hides:
multi tier suppliers
offshore intermediaries
logistics nodes outside standard reporting frameworks
actors operating below statistical visibility
The scale is smaller than in highly globalised economies, but the nature of the risk is the same. Opacity does not disappear when exposure decreases.
7. Why these dependencies matter
Finland is not vulnerable because it is open. It becomes vulnerable when parts of this openness are opaque.
A dependency you can see is a dependency you can manage.
A dependency you cannot see is a risk you do not control.
Finland depends on foreign markets for less than one third of its revenue and on foreign suppliers for less than one third of its industrial inputs. Some of these dependencies are mapped. Others are not.
The invisible part is where systemic risk accumulates.
8. What Sentinel enables
Sentinel is designed to reveal what FIGW1 hides. It provides decision makers with:
a clear map of foreign dependencies
multi tier supply chain reconstruction
identification of critical nodes
quantification of exposure across countries and sectors
visibility into blind spots that conventional datasets cannot resolve
Strategic sovereignty is not about self sufficiency. It is about visibility.
9. Conclusion and next country
Finland displays a distinct pattern:
below average dependency on foreign demand
below average dependency on foreign supply
strong Nordic and European integration
limited but persistent exposure to unidentifiable partners
a relatively resilient structure with remaining blind spots
This is analysis 6 of 27. The next country will be Austria 🇦🇹.
Understanding dependencies is the first step to managing them. The next chapters will continue to map Europe’s strategic exposure.
