
Sovereignty Insights
Denmark 2023: Understanding the foreign dependencies that shape its strategic position
A data driven analysis of who Denmark depends on and why it matters for European sovereignty
Denmark is often perceived as a balanced and resilient European economy. Strong institutions, deep Nordic and EU integration, and diversified industrial activity contribute to this image.
But resilience is not only about balance. It is about understanding where dependencies lie, and whether they are fully visible.
This analysis uses the FIGARO 2023 input output framework to map the foreign dependencies of companies registered in Denmark. It highlights who buys from Denmark, who supplies Denmark, and where blind spots emerge inside global value chains.
It is the fifth chapter of our 27 country series on European strategic dependencies.
1. Denmark’s exposure to foreign demand
In 2023, companies registered in Denmark generated 347.2 billion euros in intermediate sales. 36.88 % of this revenue came from foreign markets.
By comparison, the EU average foreign revenue dependency is 32.96 %. Denmark therefore ranks 11th out of 27 EU member states.
The internal breakdown is:
🇩🇰 Domestic market: 63.12 %
🌍 Foreign markets: 36.88 %
Inside the foreign share:
🇪🇺 EU markets: 14.18 %
🌍 Non EU markets: 22.70 %
Foreign demand is a significant component of Danish economic activity. It is not dominant, but it is structural.
2. Who buys from Denmark: the real top clients
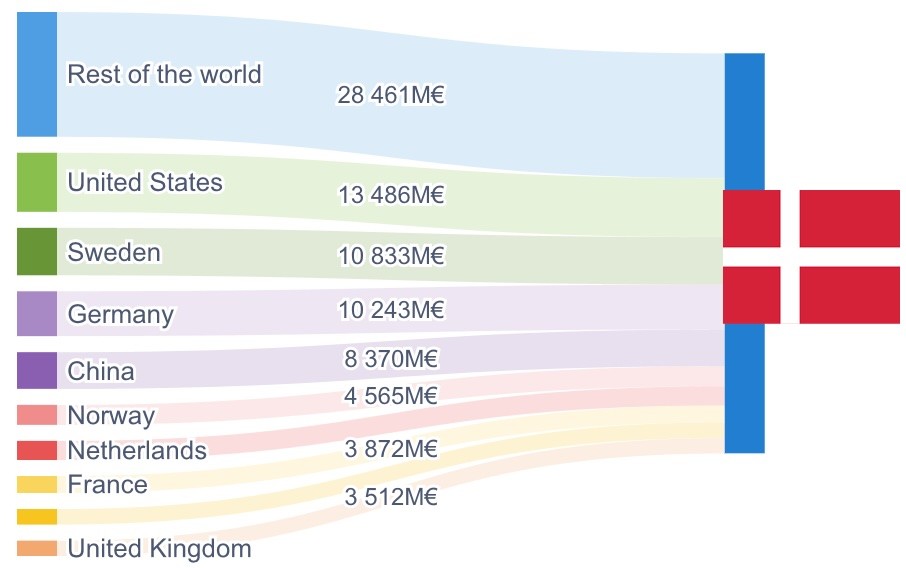
Denmark exported 128.1 billion euros of intermediate goods and services in 2023. These are the foreign buyers that shape its external exposure.
Top 5 foreign clients of Denmark:
🏴 Rest of the World (FIGW1) 8.20 %
🇺🇸 United States 3.88 %
🇸🇪 Sweden 3.12 %
🇩🇪 Germany 2.95 %
🇨🇳 China 2.41 %
FIGW1 stands out immediately. It is not a country or a geopolitical bloc. It is a statistical container used when trade flows cannot be assigned to a specific partner country.
This means that Denmark exports a non negligible share of value to actors that cannot be clearly identified at country level. For an advanced and data rich economy, this represents a structural blind spot.
3. Denmark’s exposure to foreign supply
On the input side, Denmark displays a similar pattern. In 2023, Danish companies purchased 356.2 billion euros of intermediate goods and services. 38.47 % of these inputs came from foreign suppliers.
The EU average foreign input dependency is 35 %. Denmark ranks 8th out of 27 EU member states.
The breakdown is:
🇪🇺 EU suppliers: 20.01 %
🌍 Non EU suppliers: 18.46 %
Foreign supply plays a central role in Danish production systems, particularly through European and global industrial integration.
4. Who supplies Denmark: the top foreign providers
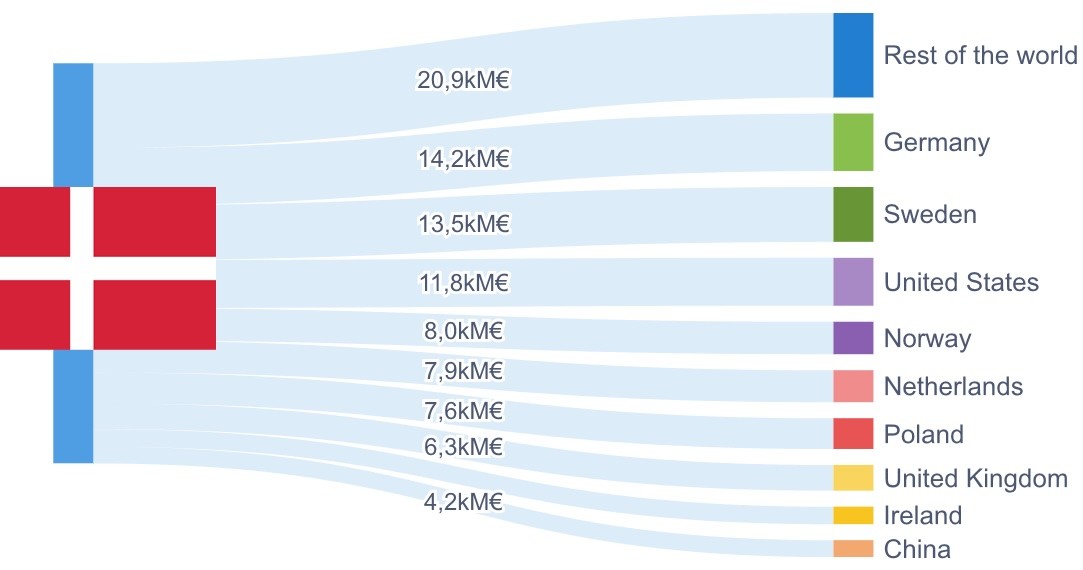
These are the foreign partners that matter most for Denmark’s industrial continuity.
Top 5 foreign suppliers of Denmark:
🏴 Rest of the World (FIGW1) 5.86 %
🇩🇪 Germany 3.99 %
🇸🇪 Sweden 3.80 %
🇺🇸 United States 3.32 %
🇳🇴 Norway 2.25 %
This structure reveals three layers:
European and Nordic integration (Germany, Sweden, Norway)
Transatlantic supply exposure (United States)
Opaque segments of the supply chain (FIGW1)
Once again, Rest of the World appears at the top, confirming a recurring structural feature.
5. Comparing Denmark to the EU: above average but not extreme
Denmark is neither an outlier nor a low exposure economy.
Foreign revenue dependency:
🇩🇰 Denmark: 36.88 %
🇪🇺 EU average: 32.96 %
Rank: 11 / 27
Foreign input dependency:
🇩🇰 Denmark: 38.47 %
🇪🇺 EU average: 35 %
Rank: 8 / 27
Denmark sits in the upper middle of the European distribution. Its exposure is controlled, but clearly above the EU average on both sides of the value chain.
6. The FIGW1 problem: structural opacity
FIGW1 appears among Denmark’s top foreign clients and top foreign suppliers. This is not a statistical anomaly. It is evidence of a blind spot embedded directly inside Danish value chains.
FIGW1 (Rest of the World) hides:
multi tier suppliers
offshore intermediaries
contract manufacturing arrangements
logistics hubs outside standard reporting frameworks
jurisdictions with limited transparency
These are the links that fail silently during crises.
7. Why these dependencies matter
Denmark is not vulnerable because it is open. It becomes vulnerable when parts of this openness are opaque.
A dependency you can see is a dependency you can manage. A dependency you cannot see is a risk you do not control.
More than one third of Danish revenue and more than one third of Danish industrial inputs depend on foreign actors. Some of these relationships are visible. Others are not.
The invisible part is where systemic risk accumulates.
8. What Sentinel enables
Sentinel is designed to reveal what FIGW1 hides. It provides decision makers with:
a clear map of foreign dependencies
multi tier supply chain reconstruction
identification of critical nodes
quantification of exposure across countries and sectors
visibility into blind spots that conventional datasets cannot resolve
Strategic sovereignty is not about self sufficiency. It is about visibility.
9. Conclusion and next country
Denmark displays a clear pattern:
moderate but above average dependency on foreign demand
above average dependency on foreign supply
strong European and Nordic integration
recurring opacity inside FIGW1
controlled exposure, but incomplete visibility
This is analysis 5 of 27. The next country will be Finland 🇫🇮.
Understanding dependencies is the first step to managing them. The next chapters will continue to map Europe’s strategic exposure.
Denmark is often perceived as a balanced and resilient European economy. Strong institutions, deep Nordic and EU integration, and diversified industrial activity contribute to this image.
But resilience is not only about balance. It is about understanding where dependencies lie, and whether they are fully visible.
This analysis uses the FIGARO 2023 input output framework to map the foreign dependencies of companies registered in Denmark. It highlights who buys from Denmark, who supplies Denmark, and where blind spots emerge inside global value chains.
It is the fifth chapter of our 27 country series on European strategic dependencies.
1. Denmark’s exposure to foreign demand
In 2023, companies registered in Denmark generated 347.2 billion euros in intermediate sales. 36.88 % of this revenue came from foreign markets.
By comparison, the EU average foreign revenue dependency is 32.96 %. Denmark therefore ranks 11th out of 27 EU member states.
The internal breakdown is:
🇩🇰 Domestic market: 63.12 %
🌍 Foreign markets: 36.88 %
Inside the foreign share:
🇪🇺 EU markets: 14.18 %
🌍 Non EU markets: 22.70 %
Foreign demand is a significant component of Danish economic activity. It is not dominant, but it is structural.
2. Who buys from Denmark: the real top clients
Denmark exported 128.1 billion euros of intermediate goods and services in 2023. These are the foreign buyers that shape its external exposure.
Top 5 foreign clients of Denmark:
🏴 Rest of the World (FIGW1) 8.20 %
🇺🇸 United States 3.88 %
🇸🇪 Sweden 3.12 %
🇩🇪 Germany 2.95 %
🇨🇳 China 2.41 %
FIGW1 stands out immediately. It is not a country or a geopolitical bloc. It is a statistical container used when trade flows cannot be assigned to a specific partner country.
This means that Denmark exports a non negligible share of value to actors that cannot be clearly identified at country level. For an advanced and data rich economy, this represents a structural blind spot.
3. Denmark’s exposure to foreign supply
On the input side, Denmark displays a similar pattern. In 2023, Danish companies purchased 356.2 billion euros of intermediate goods and services. 38.47 % of these inputs came from foreign suppliers.
The EU average foreign input dependency is 35 %. Denmark ranks 8th out of 27 EU member states.
The breakdown is:
🇪🇺 EU suppliers: 20.01 %
🌍 Non EU suppliers: 18.46 %
Foreign supply plays a central role in Danish production systems, particularly through European and global industrial integration.
4. Who supplies Denmark: the top foreign providers
These are the foreign partners that matter most for Denmark’s industrial continuity.
Top 5 foreign suppliers of Denmark:
🏴 Rest of the World (FIGW1) 5.86 %
🇩🇪 Germany 3.99 %
🇸🇪 Sweden 3.80 %
🇺🇸 United States 3.32 %
🇳🇴 Norway 2.25 %
This structure reveals three layers:
European and Nordic integration (Germany, Sweden, Norway)
Transatlantic supply exposure (United States)
Opaque segments of the supply chain (FIGW1)
Once again, Rest of the World appears at the top, confirming a recurring structural feature.
5. Comparing Denmark to the EU: above average but not extreme
Denmark is neither an outlier nor a low exposure economy.
Foreign revenue dependency:
🇩🇰 Denmark: 36.88 %
🇪🇺 EU average: 32.96 %
Rank: 11 / 27
Foreign input dependency:
🇩🇰 Denmark: 38.47 %
🇪🇺 EU average: 35 %
Rank: 8 / 27
Denmark sits in the upper middle of the European distribution. Its exposure is controlled, but clearly above the EU average on both sides of the value chain.
6. The FIGW1 problem: structural opacity
FIGW1 appears among Denmark’s top foreign clients and top foreign suppliers. This is not a statistical anomaly. It is evidence of a blind spot embedded directly inside Danish value chains.
FIGW1 (Rest of the World) hides:
multi tier suppliers
offshore intermediaries
contract manufacturing arrangements
logistics hubs outside standard reporting frameworks
jurisdictions with limited transparency
These are the links that fail silently during crises.
7. Why these dependencies matter
Denmark is not vulnerable because it is open. It becomes vulnerable when parts of this openness are opaque.
A dependency you can see is a dependency you can manage. A dependency you cannot see is a risk you do not control.
More than one third of Danish revenue and more than one third of Danish industrial inputs depend on foreign actors. Some of these relationships are visible. Others are not.
The invisible part is where systemic risk accumulates.
8. What Sentinel enables
Sentinel is designed to reveal what FIGW1 hides. It provides decision makers with:
a clear map of foreign dependencies
multi tier supply chain reconstruction
identification of critical nodes
quantification of exposure across countries and sectors
visibility into blind spots that conventional datasets cannot resolve
Strategic sovereignty is not about self sufficiency. It is about visibility.
9. Conclusion and next country
Denmark displays a clear pattern:
moderate but above average dependency on foreign demand
above average dependency on foreign supply
strong European and Nordic integration
recurring opacity inside FIGW1
controlled exposure, but incomplete visibility
This is analysis 5 of 27. The next country will be Finland 🇫🇮.
Understanding dependencies is the first step to managing them. The next chapters will continue to map Europe’s strategic exposure.

